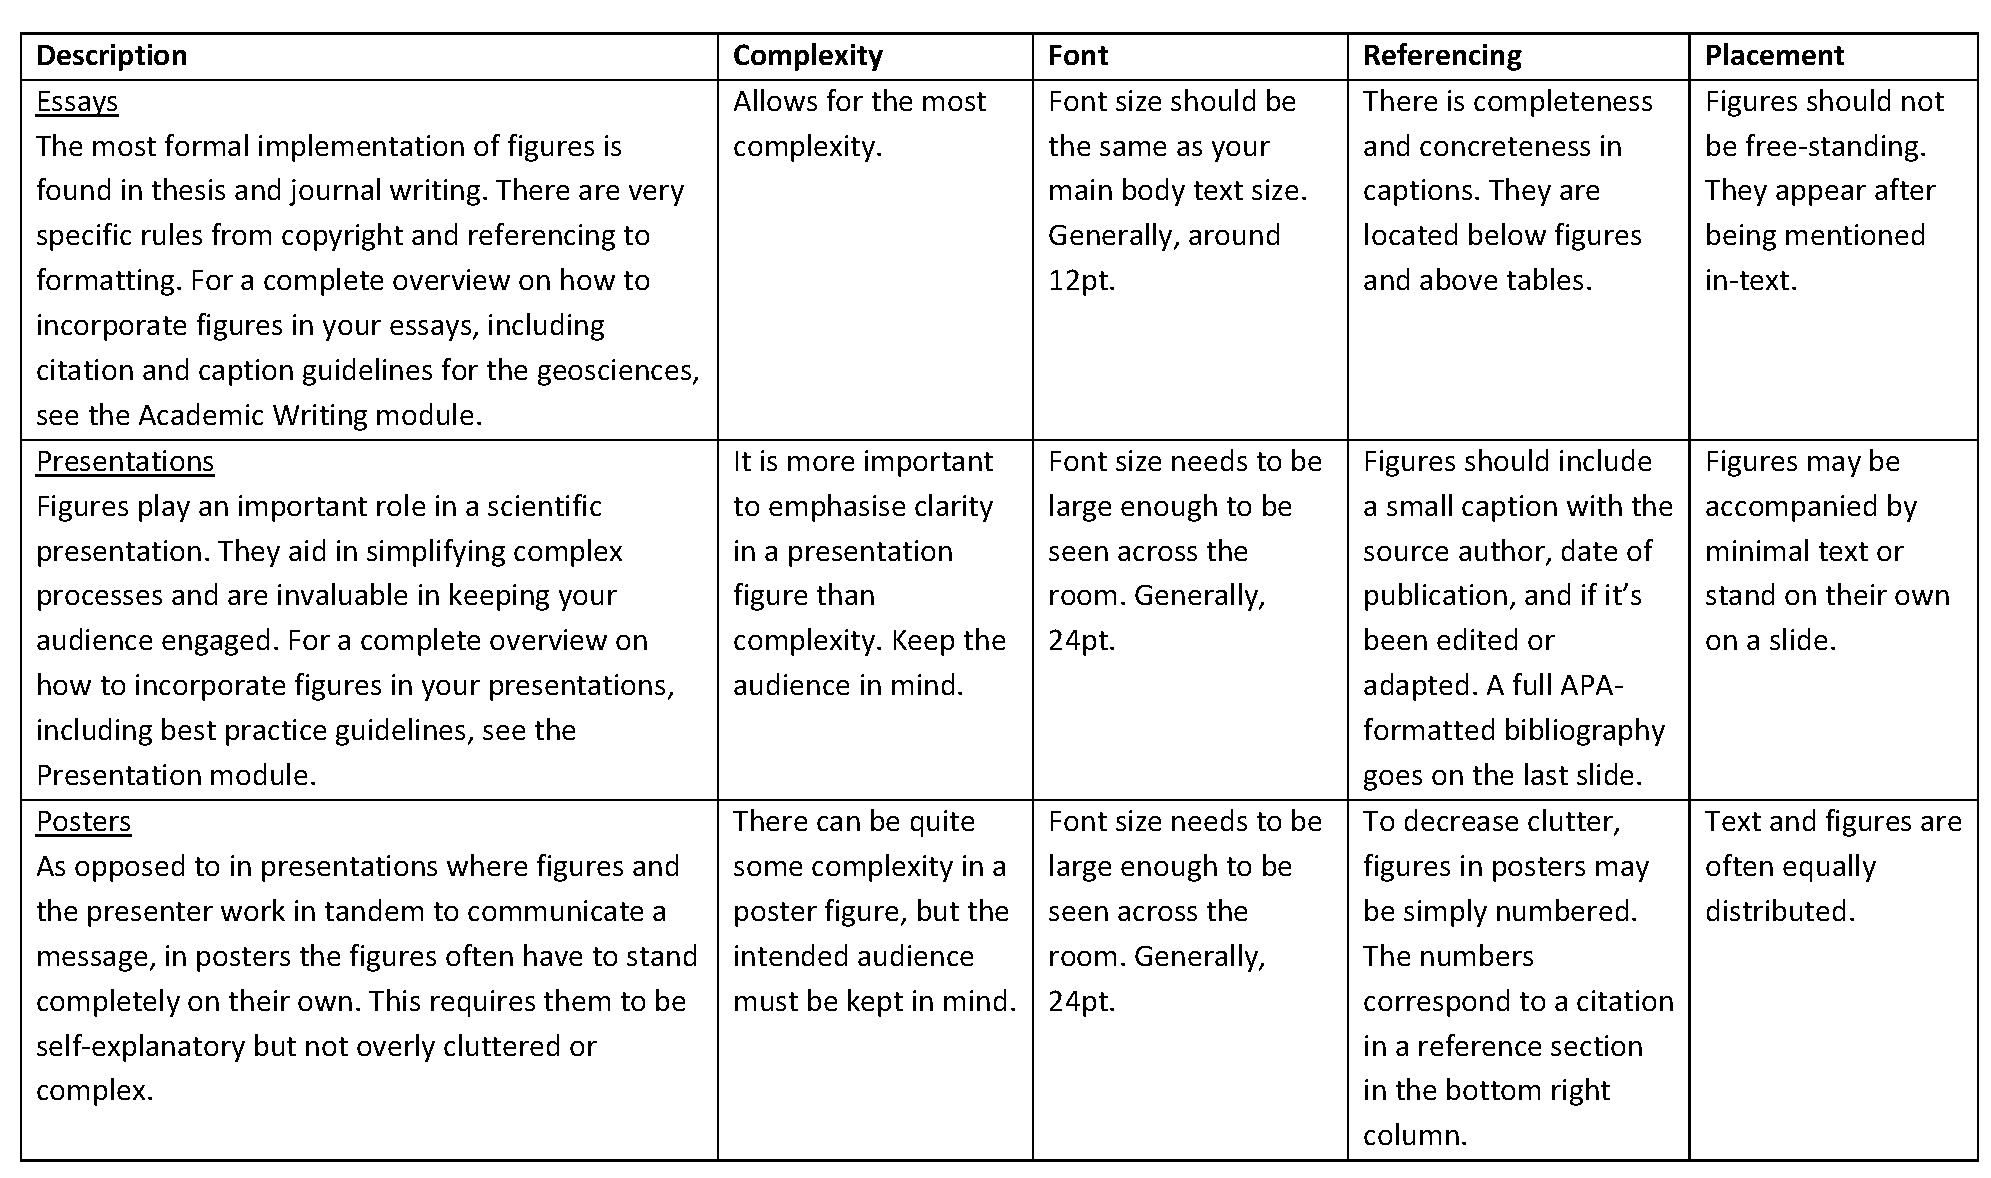
Adapt your figures to the medium you are using
You also need to adapt your figures to the medium you are using (see table below). On a PowerPoint in an oral presentation, your audience will look at your figure in a different way than in a scientific paper. For oral presentations, you want to keep your figures simple and you want your message to stand out. Your audience will only look at your figure for a short time, and from a distance. This means that your graph needs to contain less details and needs a bigger font size and line thickness for an oral presentation than for a scientific paper13. For an example of this, see Fig. 3 in this paper from Rougier et al. (2014). It also contains other tips for making graphs.
If you are making a figure for a specific journal, always start with checking the boundary conditions for size and work from there. This prevents your figure from becoming unreadable when it is shrunken by the journal editor to fit the size restrictions of the journal. Also check in what format the presented text and figures need to be, e.g., in A4 or A3 format.